
Clickio
Data Insights
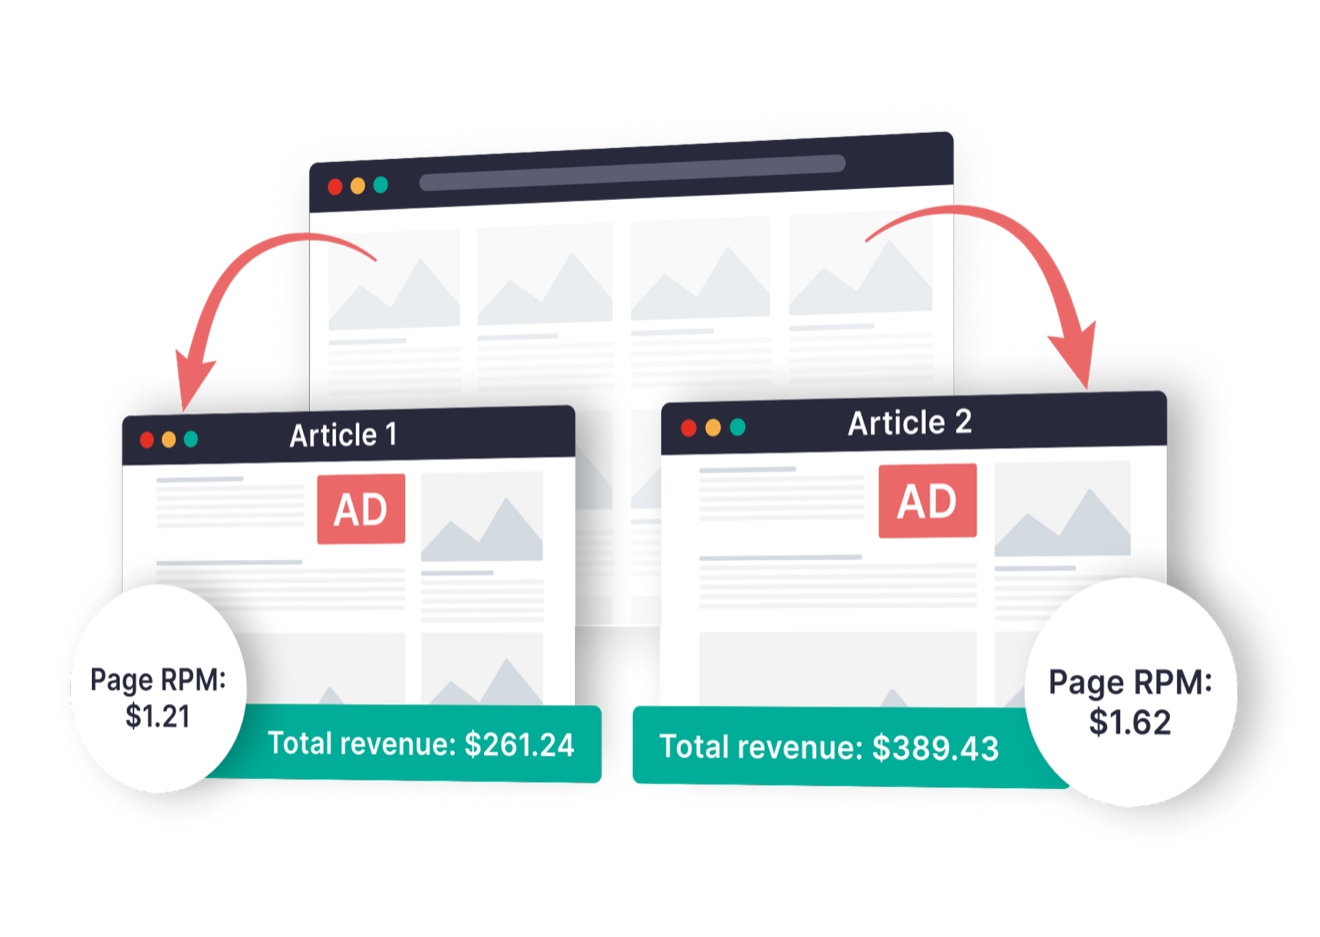
Find out exactly which articles or authors are bringing you the most revenue - so you can focus on the most lucrative content.
GET STARTED
Data-driven decision
Utilize data analytics to optimize content, advertising, and user engagement.

Improve content strategy
Refine content based on data insights, tailoring it to audience preferences and high-performing topics.

Optimize ad density
Adjust ad placement and marketing strategies based on data analytics to maximize results.
Assess traffic sources
Examine traffic origins, distribute resources strategically, and adapt marketing strategies to maximize ad effectiveness.
Pinpoint opportunities for revenue growth
As well as seeing at a glance your earnings for each page on your site, you can check advertising revenue by:
 Author
 Category
 Page URL
 Advertiser
 Device
 Geography
You can even set up your own custom groups for comparison – to test the impact of new features or site changes on your earnings.
Easy Data Comparison
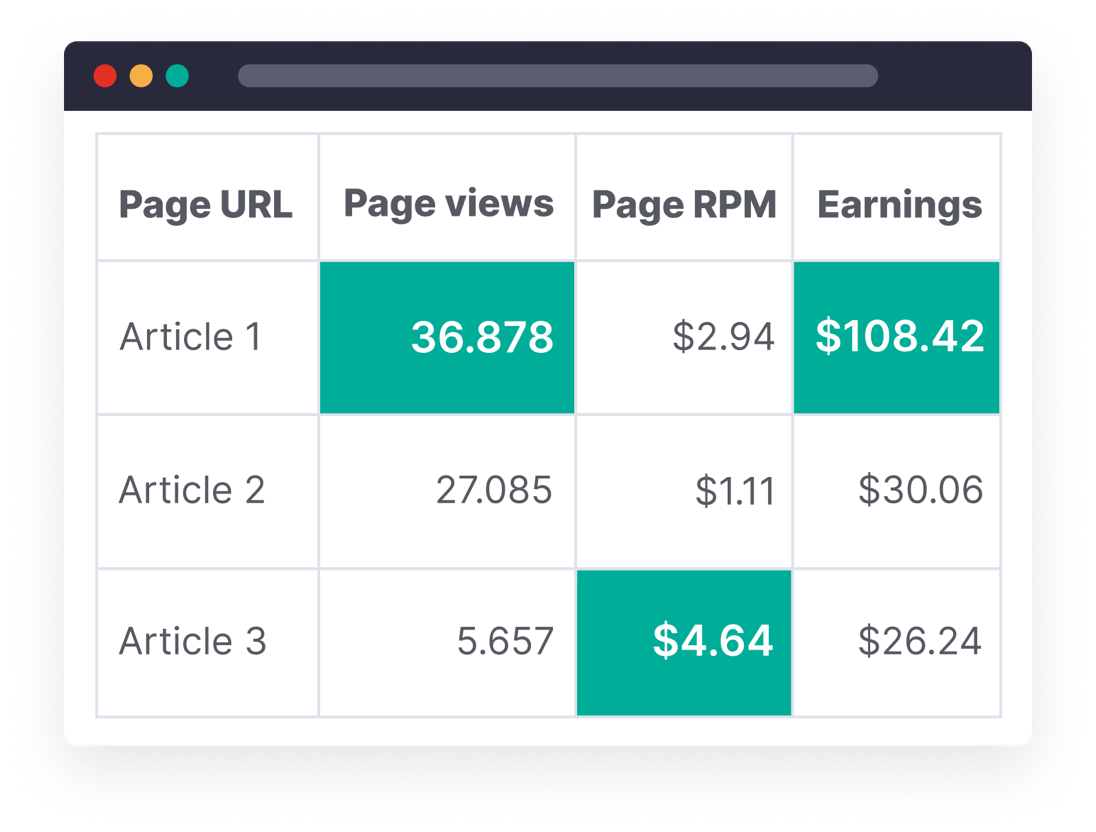
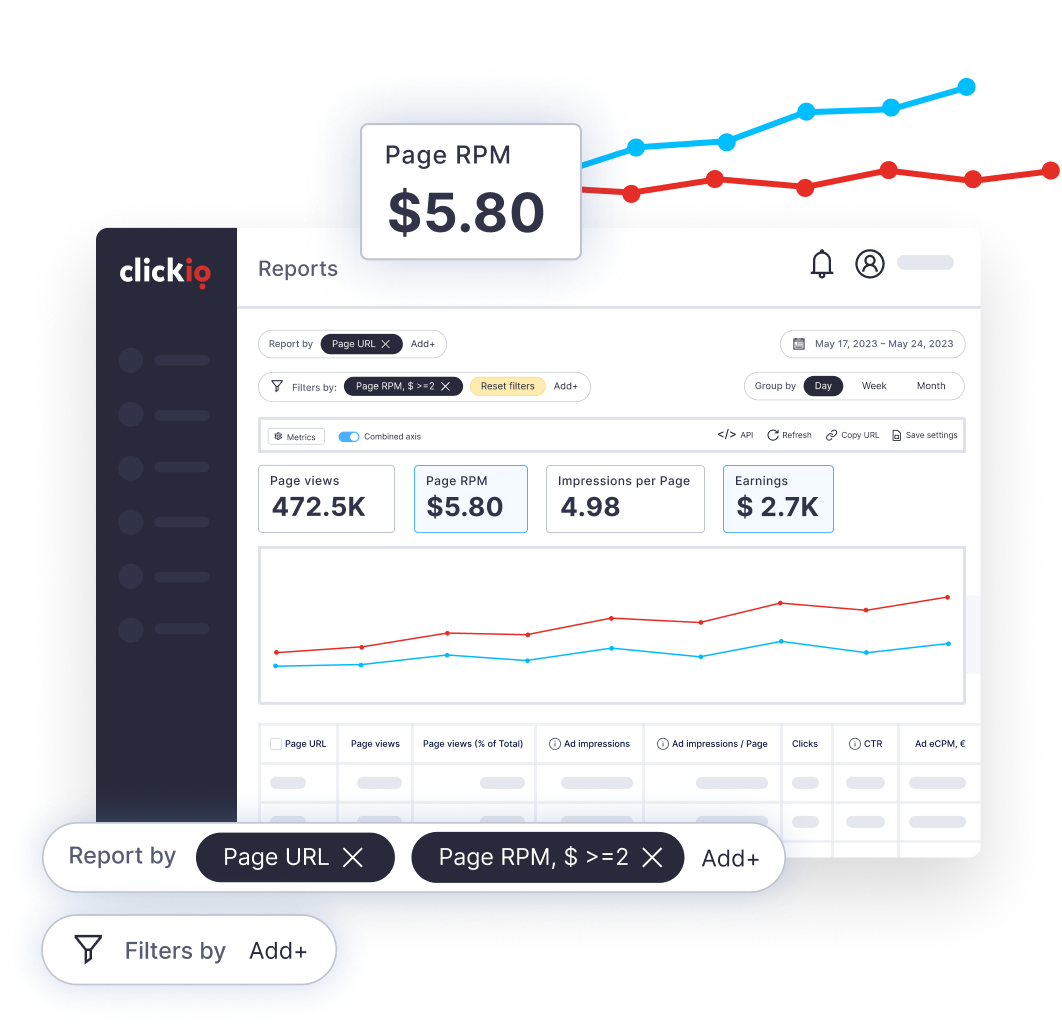
Clickio Data Insights shows key metrics such as Page Views, Page RPM and Earnings for each individual page on your site - in one easy-to-read dashboard.
Improve Revenue and User Experience
By monitoring and optimizing such metrics as Page RPM and Impressions per Page, ensure the perfect ad density to balance revenue and user experience.
Comply with Google Discover and Google News
Monitor compliance with Google Transparency requirements. Make sure all articles contain the correct author information, which is a mandatory requirement under the Google News and Google Discover transparency policies.





Empower your team
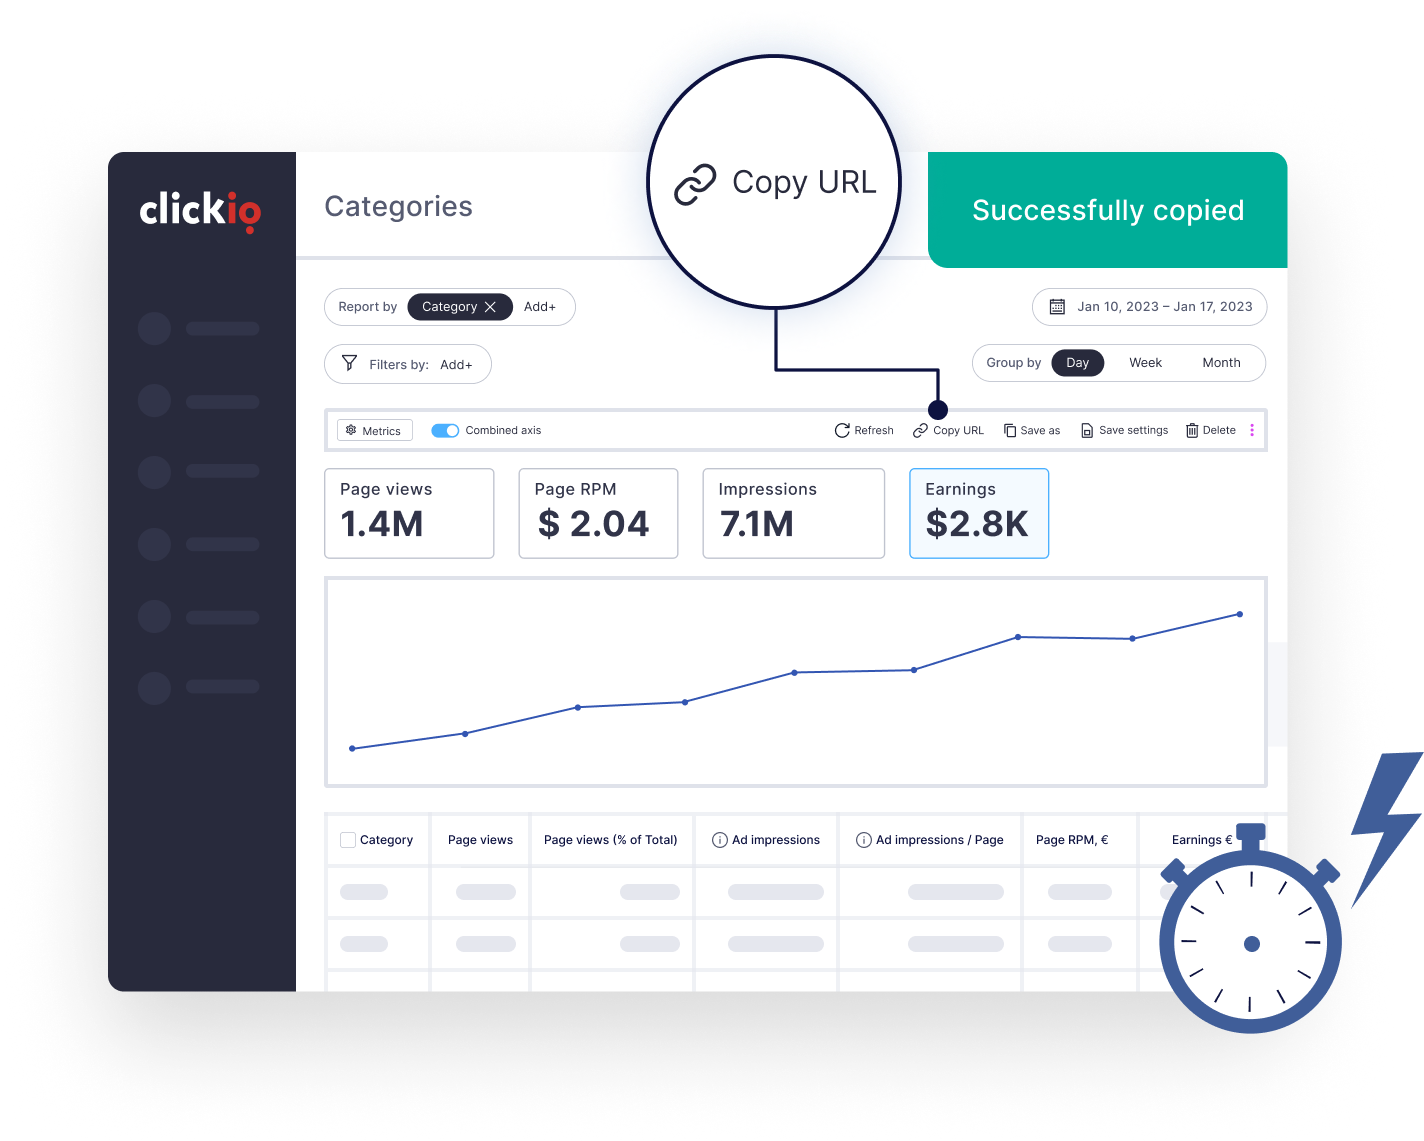
Data Insights reports are fast, fully customizable and easy to use. Share your reports in one click to guarantee optimal team productivity.